Introduction: Why Traders Are Looking Beyond Traditional Indicators
The financial markets of 2026 are more competitive than ever. Retail traders now have access to sophisticated charting platforms, institutional-grade data feeds, AI-powered analysis tools, and real-time market information that was once available only to hedge funds and professional trading desks. Despite this evolution, many traders continue to struggle with a common problem: understanding why the market moves the way it does.
Traditional technical analysis remains valuable, but indicators often react after significant market activity has already occurred. A moving average crossover, for example, confirms a trend that may have started days earlier. Oscillators and momentum indicators can identify overbought or oversold conditions, yet they rarely explain the underlying forces responsible for those conditions.
This growing demand for deeper market intelligence has pushed traders toward options-market analysis. Among the platforms leading this trend is SpotGamma, a specialized analytics solution designed to help traders understand the impact of options positioning on market behavior.
Instead of focusing solely on price action, SpotGamma examines the structure of the options market and how dealer hedging activities influence stock and index movements. This perspective provides traders with a unique advantage: the ability to identify critical market levels before major price reactions occur.
As options trading continues to account for a larger share of overall market activity, understanding these hidden dynamics has become increasingly important for anyone seeking a competitive edge.
The Evolution of Market Analysis in 2026
Over the last decade, market participants have gradually shifted from relying exclusively on charts and economic news toward incorporating alternative data sources into their trading process.
Institutional investors have long understood that options markets contain valuable information about future expectations. Large positions in options contracts often force market makers and dealers to adjust their hedges, creating buying and selling pressure that can influence the underlying asset.
This is where SpotGamma differentiates itself from conventional market analysis platforms.
Rather than analyzing only historical price movement, SpotGamma focuses on understanding how options exposure may affect future market behavior. The platform evaluates gamma exposure, dealer positioning, open interest concentrations, and volatility-related metrics to reveal forces that are often invisible to most traders.
As markets become increasingly driven by derivatives activity, many professionals believe that understanding options flows is no longer optional. It is becoming an essential component of modern market analysis.
Understanding the Core Concepts Behind SpotGamma
To appreciate the value of SpotGamma, it is important to understand the mechanisms that drive its insights.
The options market consists of buyers and sellers with varying expectations about future price movement. Market makers facilitate transactions by providing liquidity. In order to manage risk, these market makers frequently hedge their exposure by buying or selling shares of the underlying asset.
These hedging activities can create significant market impact.
When options positioning reaches certain levels, dealer hedging may amplify market trends or suppress volatility. This phenomenon often explains why markets appear to become “stuck” around specific price zones or suddenly experience explosive directional moves.
SpotGamma translates these complex interactions into understandable market signals that traders can incorporate into their decision-making process.
Rather than requiring advanced mathematical knowledge, the platform presents information in a practical format that helps users identify important levels, anticipate volatility conditions, and better understand market structure.
How Dealer Hedging Shapes Market Behavior
One of the most fascinating aspects of modern markets is the role dealers play in price formation.
Every day, market makers adjust positions in response to changes in options exposure. These adjustments create flows that can directly influence stocks, ETFs, and broad market indices.
The analytical framework provided by SpotGamma focuses heavily on this relationship.
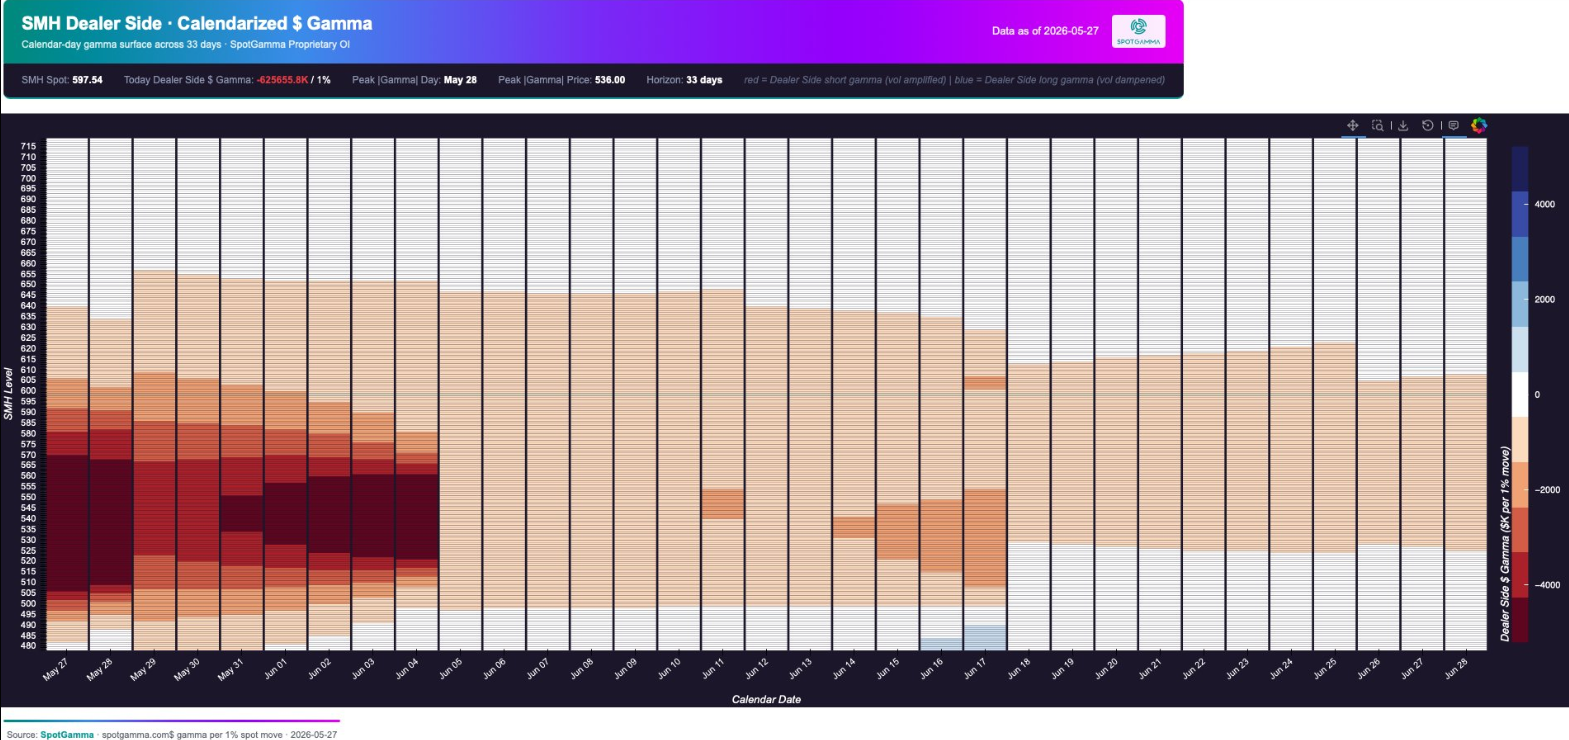
For example, when dealers are positioned in a positive gamma environment, their hedging activity tends to dampen volatility. Price swings become smaller, support and resistance levels become more reliable, and markets often trade within relatively predictable ranges.
Conversely, negative gamma conditions can produce the opposite effect. Dealer hedging may reinforce price movement rather than offset it, resulting in larger and more aggressive market swings.
By identifying these conditions, SpotGamma helps traders adapt their strategies to changing market environments rather than applying the same approach under every circumstance.
This understanding can be particularly valuable during earnings seasons, Federal Reserve announcements, and periods of elevated market uncertainty.
The Importance of Key Market Levels
Successful trading often comes down to identifying the right levels.
Support and resistance remain foundational concepts, but options markets can reveal a deeper layer of information. Large concentrations of options contracts frequently create areas where dealer activity becomes significant.
This is one of the reasons many traders rely on SpotGamma.
The platform highlights levels where market participants may encounter increased buying pressure, selling pressure, or volatility compression. These zones often become critical decision points that influence short-term and medium-term market direction.
When traders understand where institutional positioning is concentrated, they can better anticipate how markets might react as prices approach those areas.
Instead of guessing where support or resistance may exist, SpotGamma provides a data-driven framework for evaluating market structure.
Such insights can improve trade planning, stop-loss placement, profit targets, and overall risk management.
Why Options Data Matters More Than Ever
The influence of options markets has expanded dramatically over the past several years.
Daily options volume has grown substantially, with zero-day-to-expiration contracts becoming increasingly popular among active traders. As options activity grows, its impact on the underlying market becomes more pronounced.
This trend makes platforms like SpotGamma especially relevant in 2026.
Many market moves that appear random on a chart can often be traced back to options positioning and dealer hedging requirements. Understanding these relationships allows traders to see the market through a different lens.
Rather than reacting emotionally to sudden volatility, traders can evaluate whether a move aligns with existing options-related pressures.
The result is often a more disciplined and informed approach to market participation.
How Traders Use SpotGamma in Real Trading Strategies
The practical applications of SpotGamma extend across multiple trading styles.
Day traders frequently use the platform to identify important intraday levels and volatility expectations. Knowing where dealer-related support and resistance may exist can help improve timing and trade execution.
Swing traders often incorporate SpotGamma into broader market analysis by combining options-derived levels with trend analysis, momentum indicators, and macroeconomic research.
Long-term investors can also benefit by gaining insight into institutional positioning and understanding how derivatives markets may influence broader market behavior.
Because the platform focuses on market structure rather than predictions, users are able to develop more objective trading plans based on measurable data rather than speculation.
This flexibility is one reason why SpotGamma continues to attract a diverse user base ranging from beginners to experienced professionals.
Advantages Over Traditional Technical Analysis
Technical indicators remain useful tools, but they have limitations.
Most indicators are derived from price itself, meaning they inherently lag market activity. By the time a signal appears, a significant portion of the move may already have occurred.
The analytical approach used by SpotGamma offers a different perspective.
Instead of simply measuring what has happened, the platform attempts to identify conditions that may influence what happens next. This forward-looking framework can complement traditional analysis and provide additional context during uncertain market conditions.
Many traders find that combining chart-based analysis with SpotGamma insights creates a more comprehensive understanding of market behavior.
Rather than replacing existing strategies, options analytics often enhance them.
Final Thoughts: What SpotGamma Sees Before the Market Moves
Modern markets are increasingly shaped by derivatives activity, institutional positioning, and dealer hedging behavior. Traders who focus exclusively on price charts may overlook some of the most influential forces operating beneath the surface.
This is precisely where SpotGamma delivers value.
By translating complex options-market data into actionable insights, SpotGamma helps traders understand market structure, identify key levels, evaluate volatility conditions, and prepare for potential price reactions before they occur.
In an environment where information advantages can make a significant difference, SpotGamma has established itself as one of the most respected tools for options-based market analysis.
For traders seeking a deeper understanding of what drives modern markets, SpotGamma offers a perspective that extends far beyond traditional technical indicators. The ability to see hidden market forces before they become visible on a chart may be one of the most valuable advantages a trader can have in 2026.